Watering and draining planets
What the Earth would look like if the sea level suddenly changed? And what would be the Moon, Mars and Venus with as much water as on the Earth? Show this on the following maps and compare our Earth with other astronomical objects.
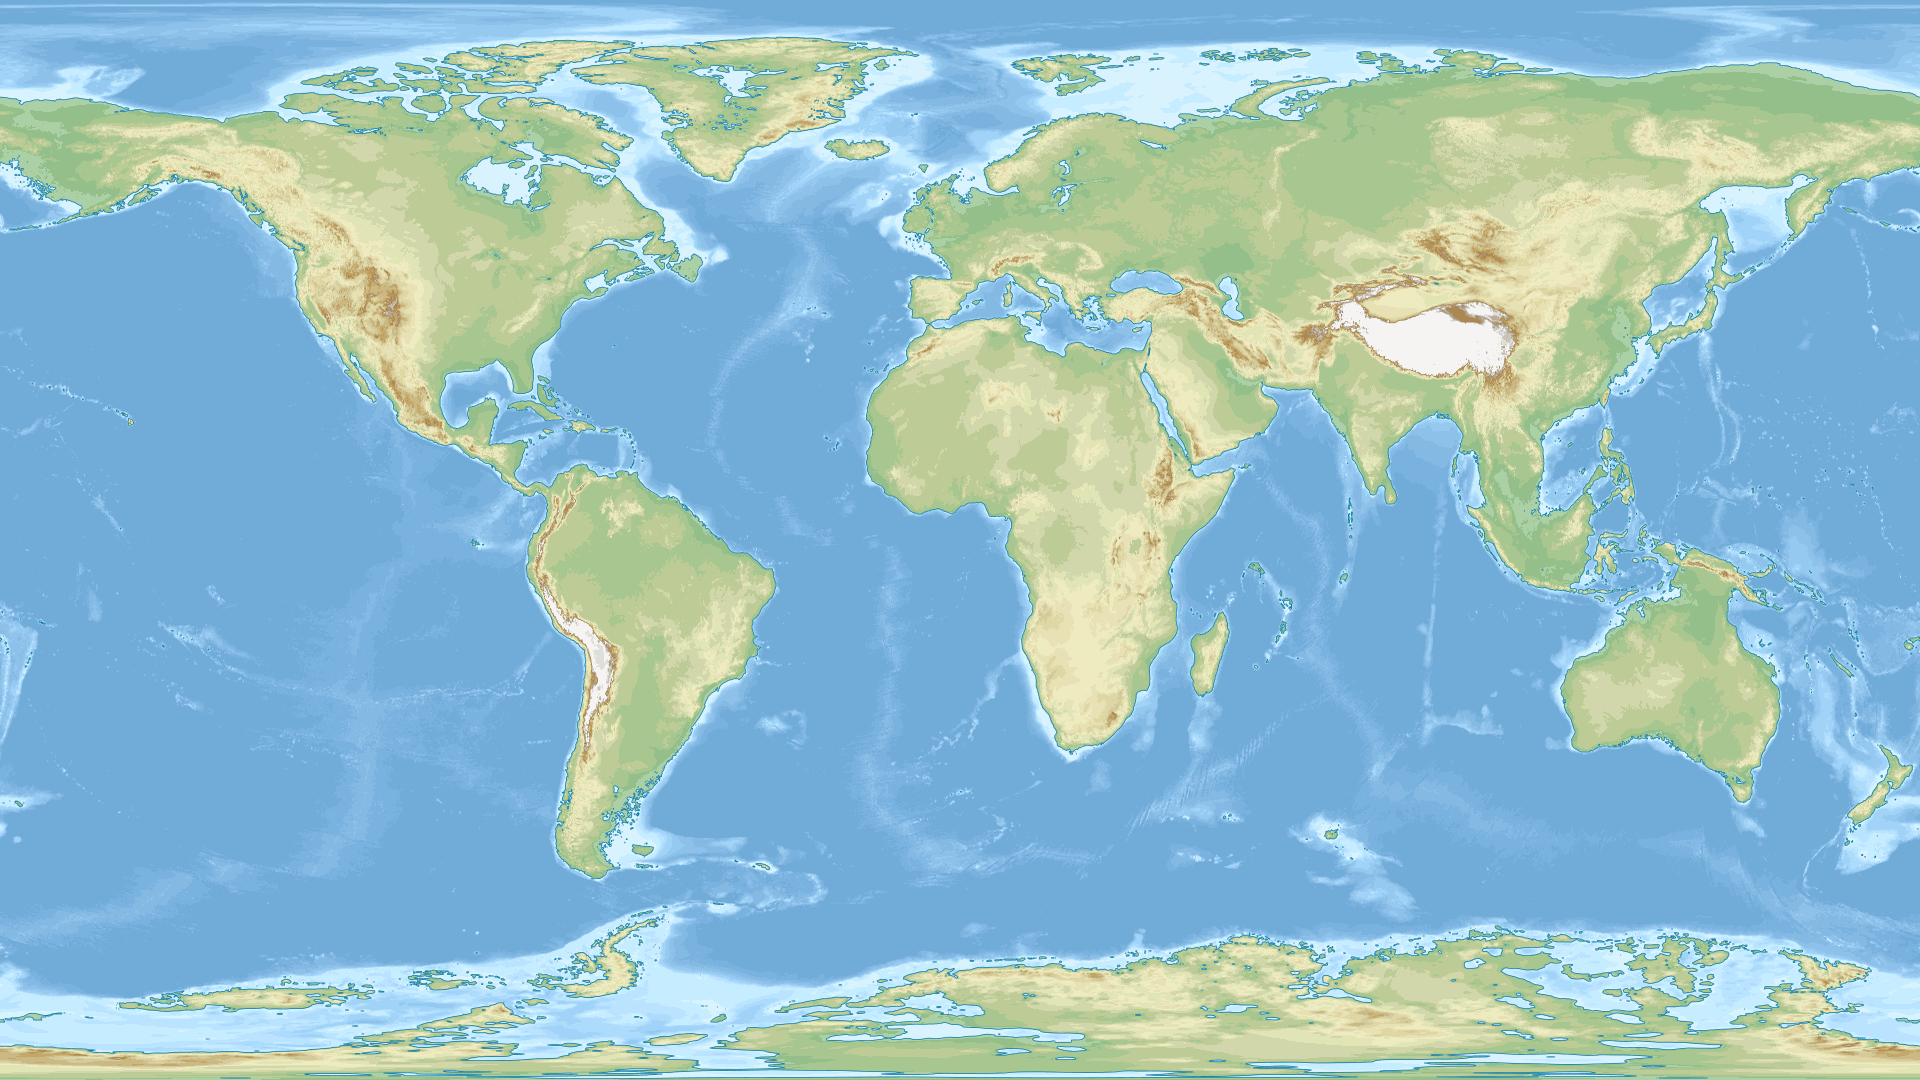
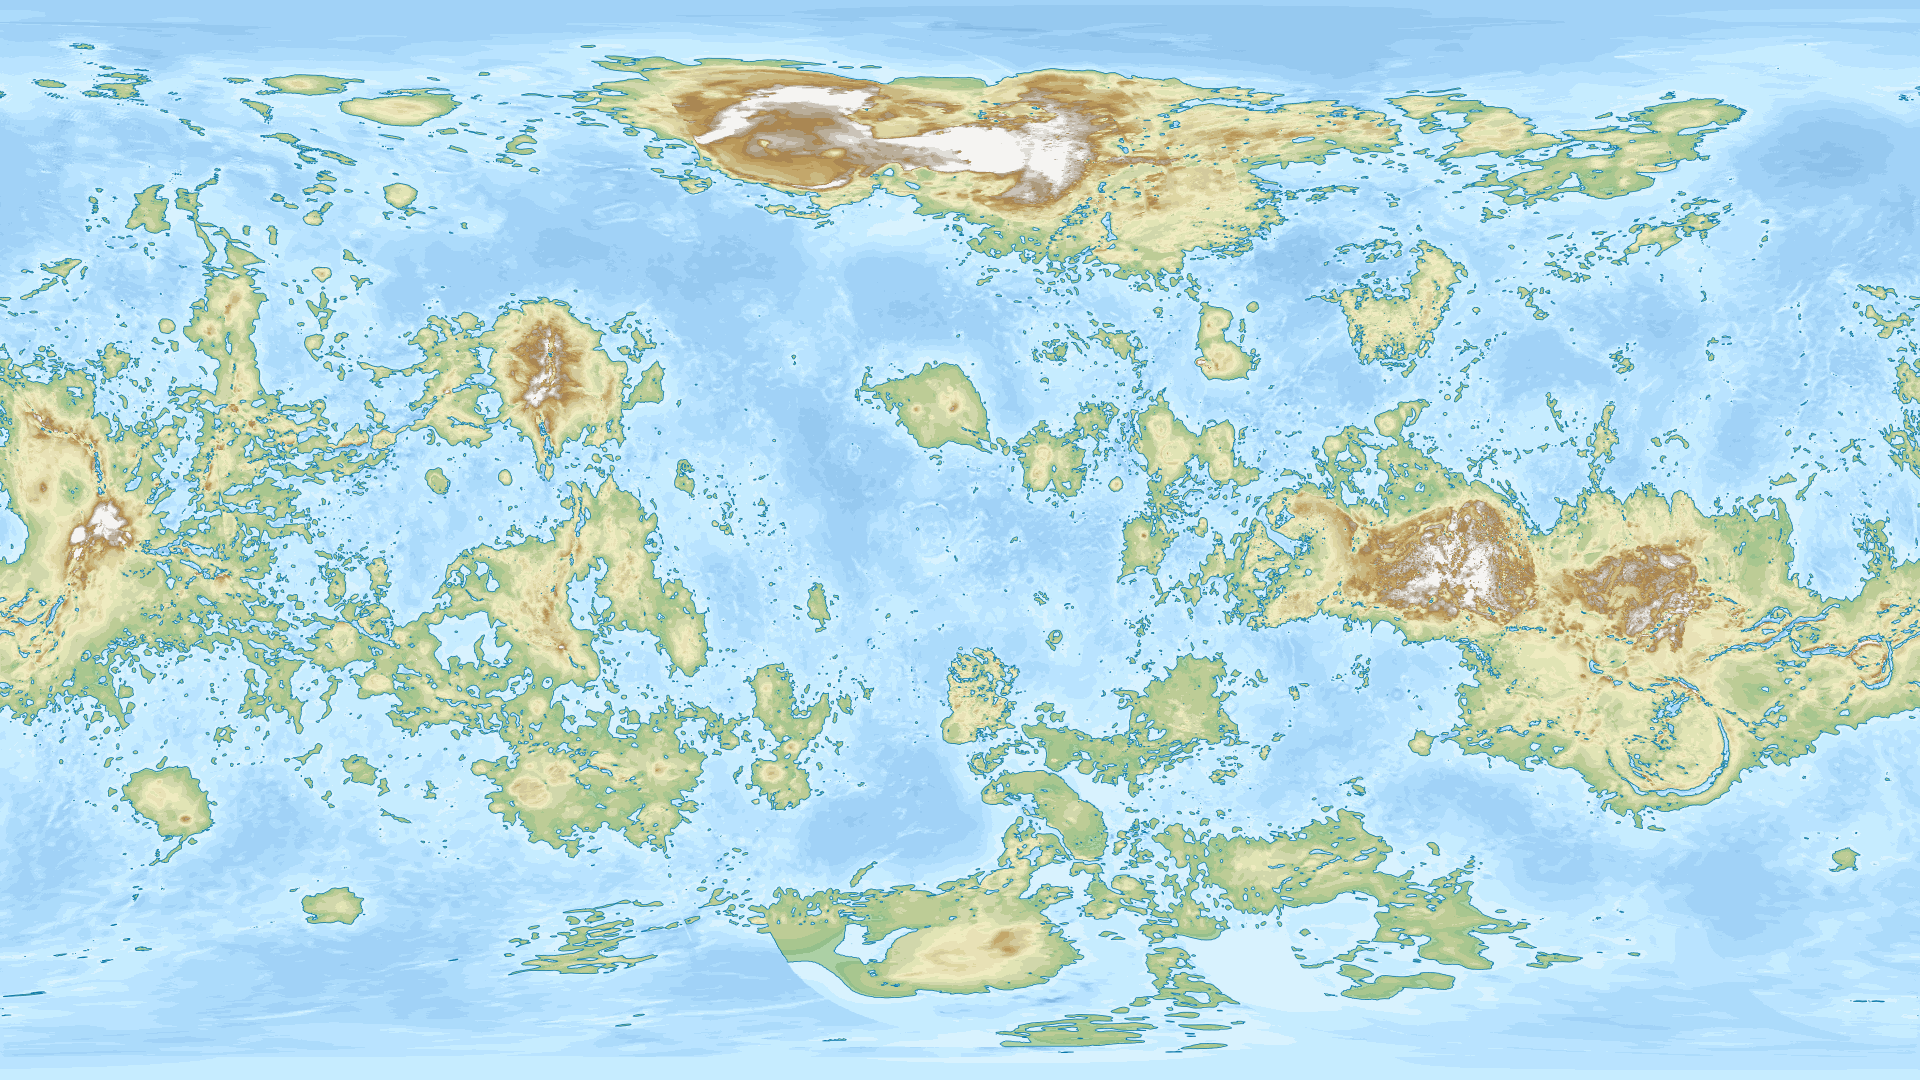
World maps. On this first map, we can show how the
world would be if the sea level increased by +100m.

On this second map, the sea level increased by +1000m.
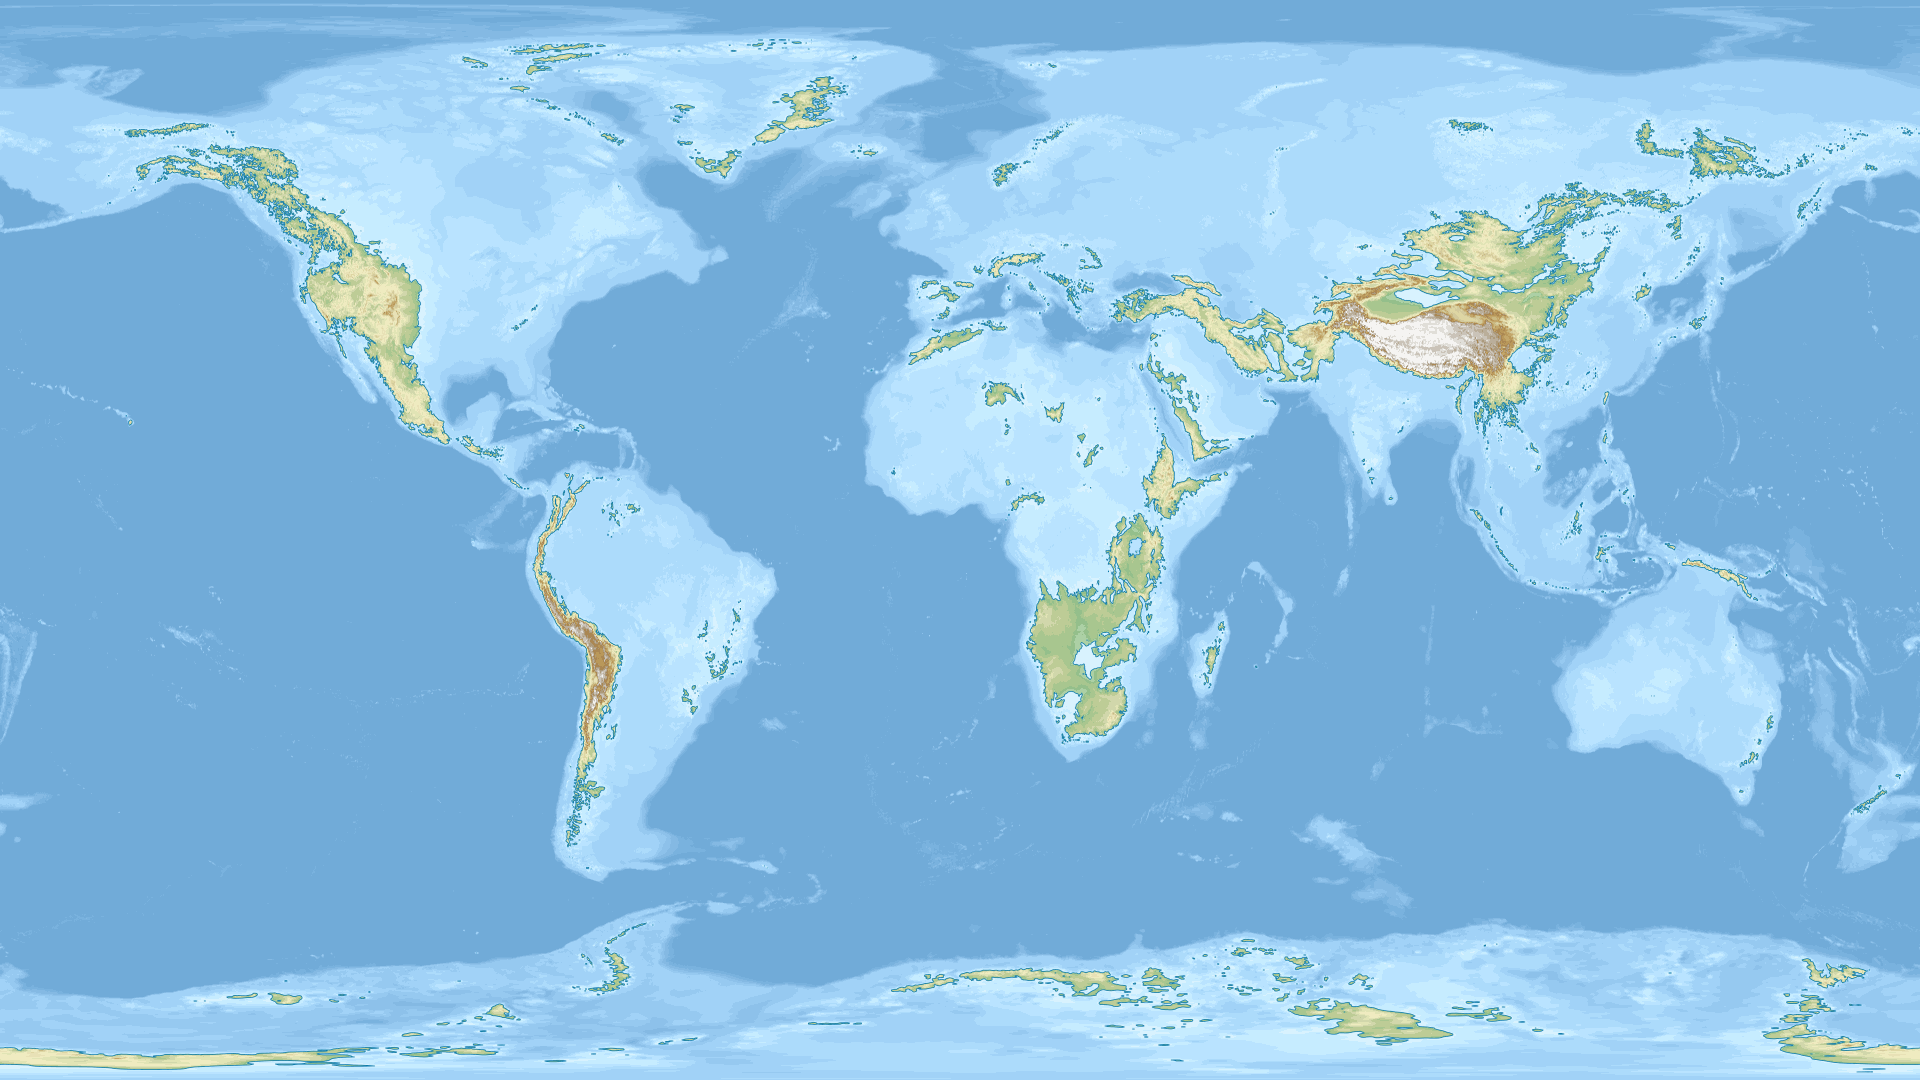
You can browse many other sea level shifts here.
Note that the maps are bedrock, i.e. without any ice surface. That’s why Antarctica forms several islands and a hole is on the center of Greenland.
The map associated with a fall of 100m of the sea level might represent the bedrock Earth 18000 years ago (ignoring the plate tectonic effects). On that map, we can observe that Russia and USA merge together, as the United Kingdom with mainland Europe. For comparison, if all the ice melted on the Earth, the sea level would increase by 60m
Celestial objects maps. On the following maps, we can see the Moon, Venus and Mars with about 70% of their surface covered by water.
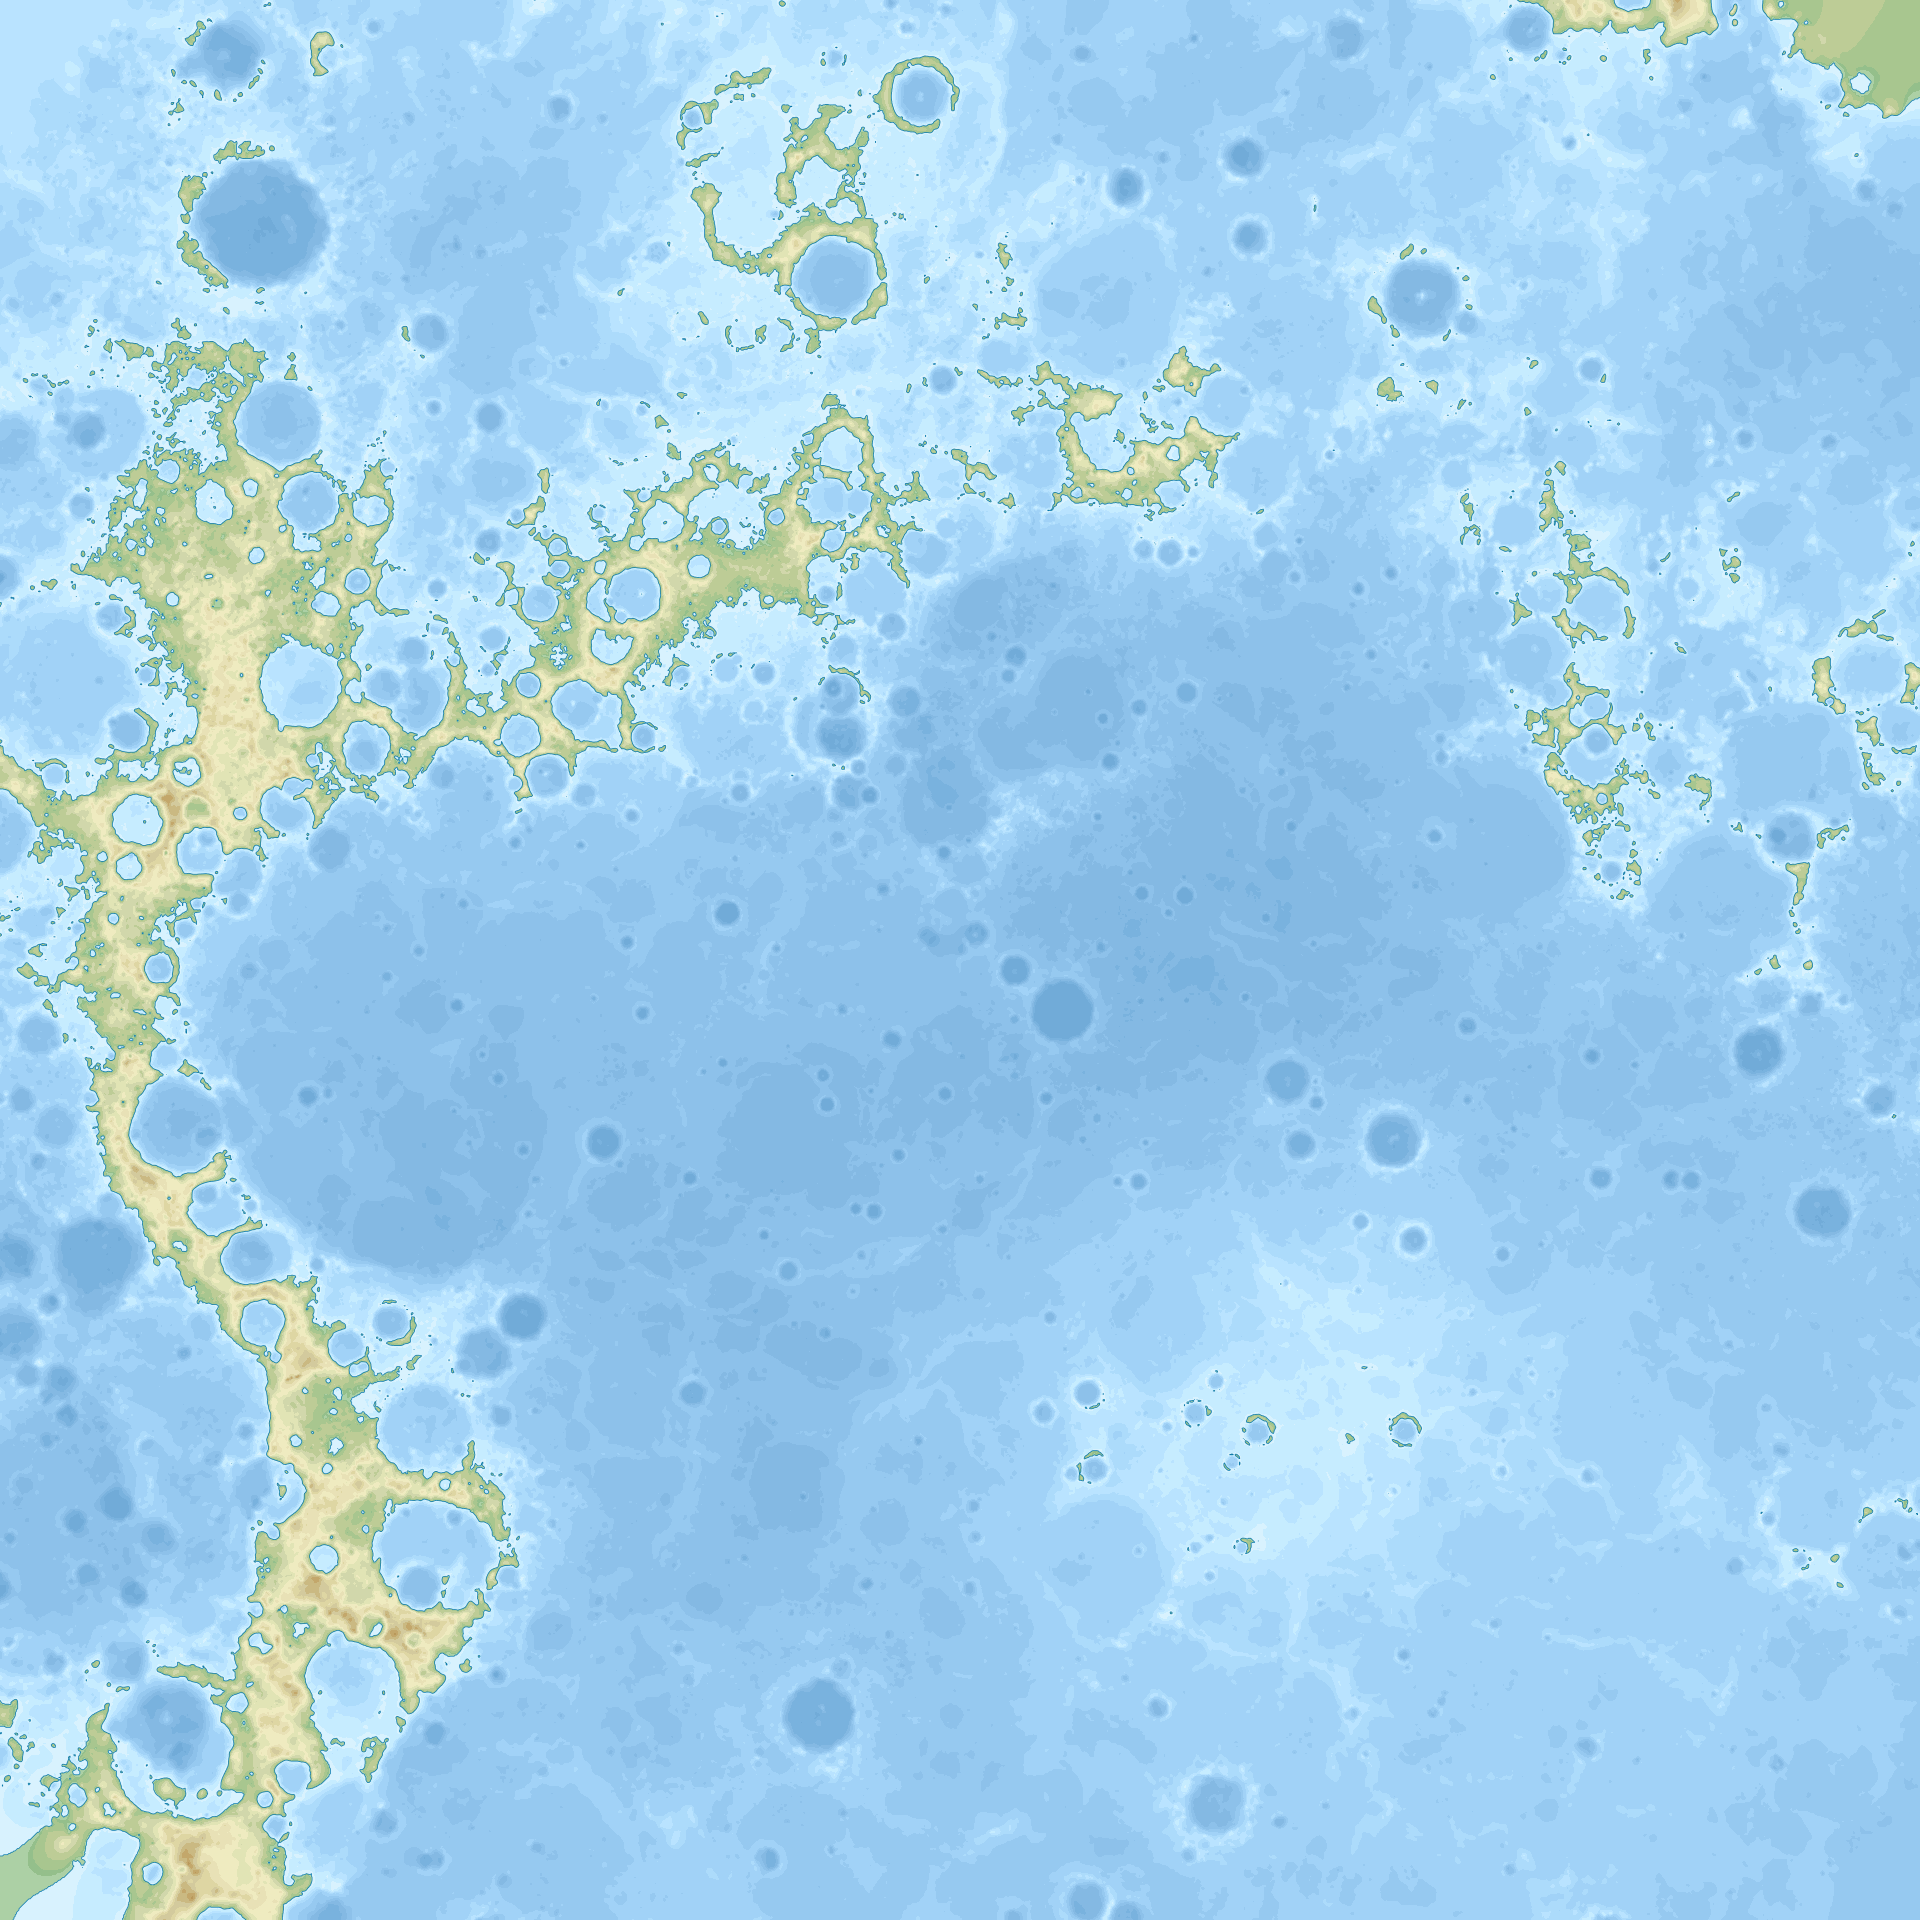
The Moon
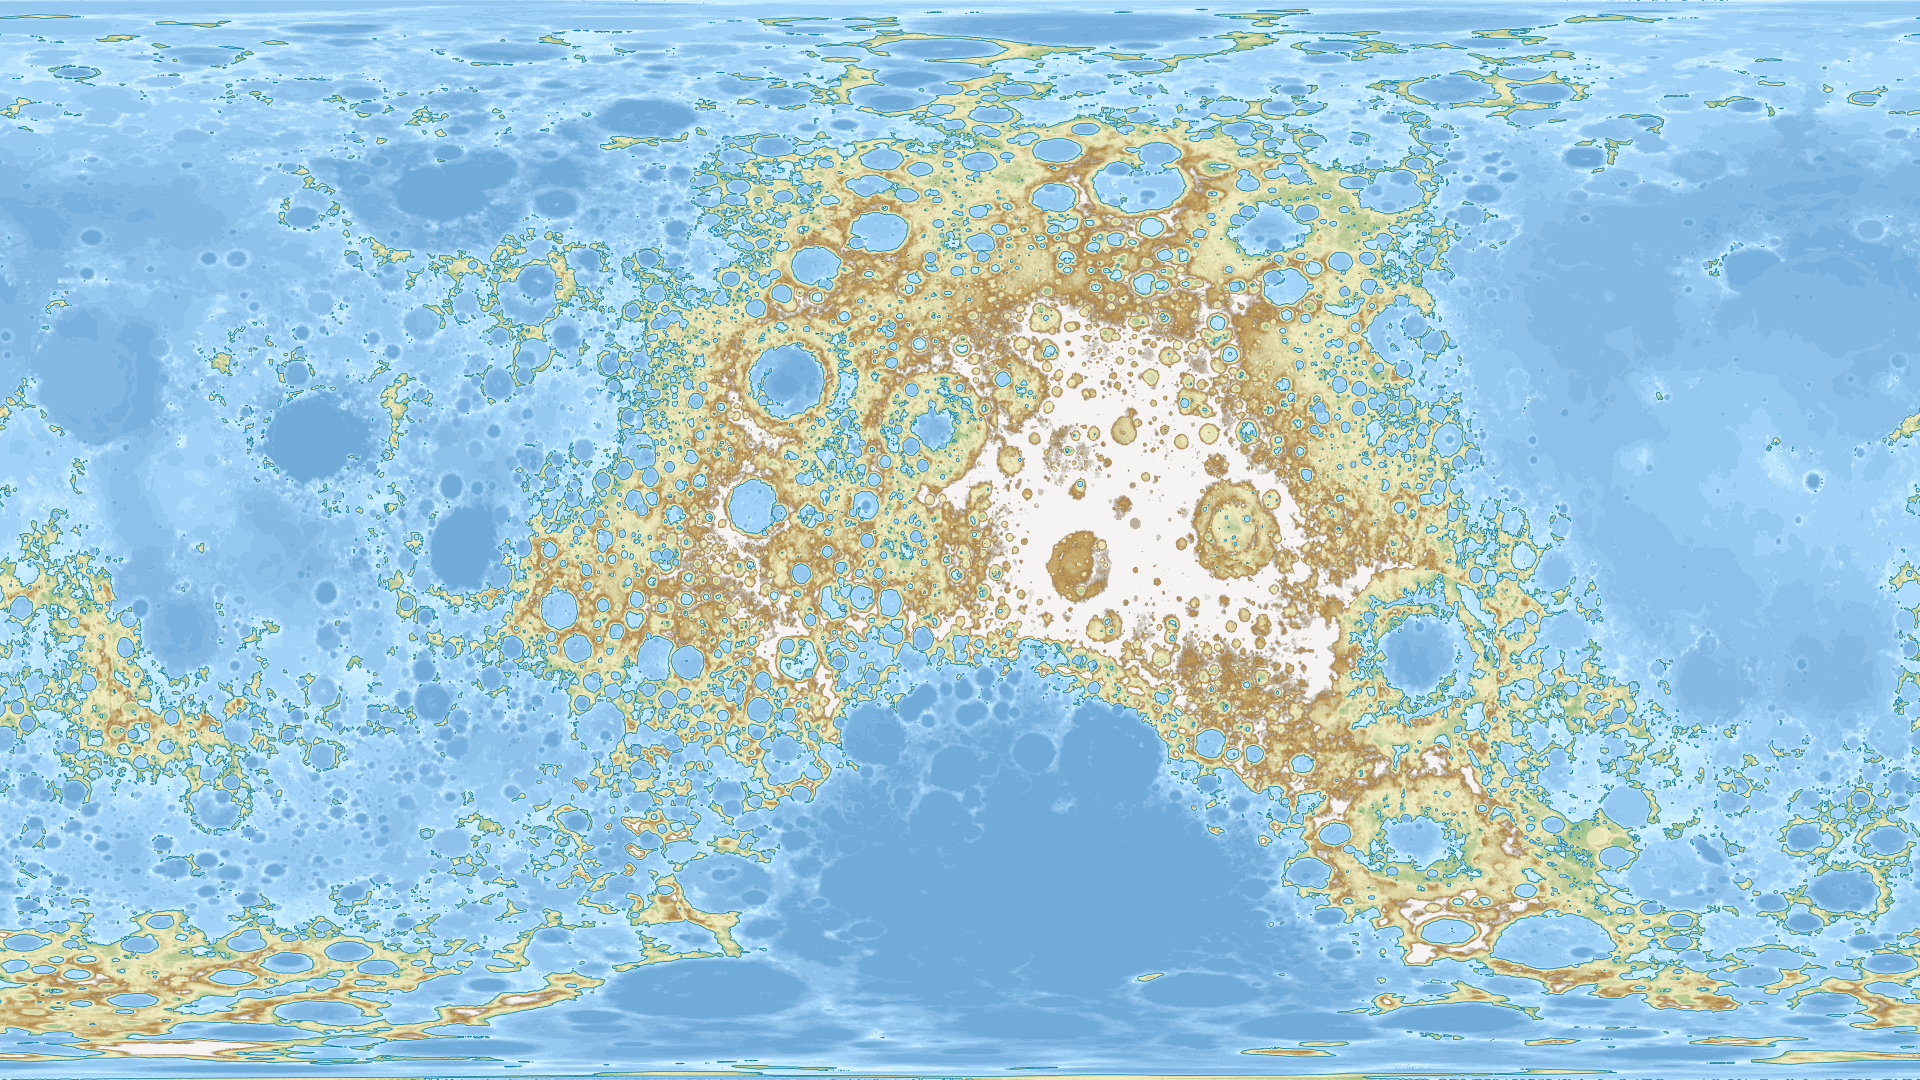 The Moon is full of craters, and strangely the far side (on the center of the map)
is higher than the near side (on the right and on the left).
The Moon is full of craters, and strangely the far side (on the center of the map)
is higher than the near side (on the right and on the left).
Venus
 Venus is a quite flat planet, except on Ishtar Terra (on the north) and on Aphrodite Terra (on the right on the map).
Mars
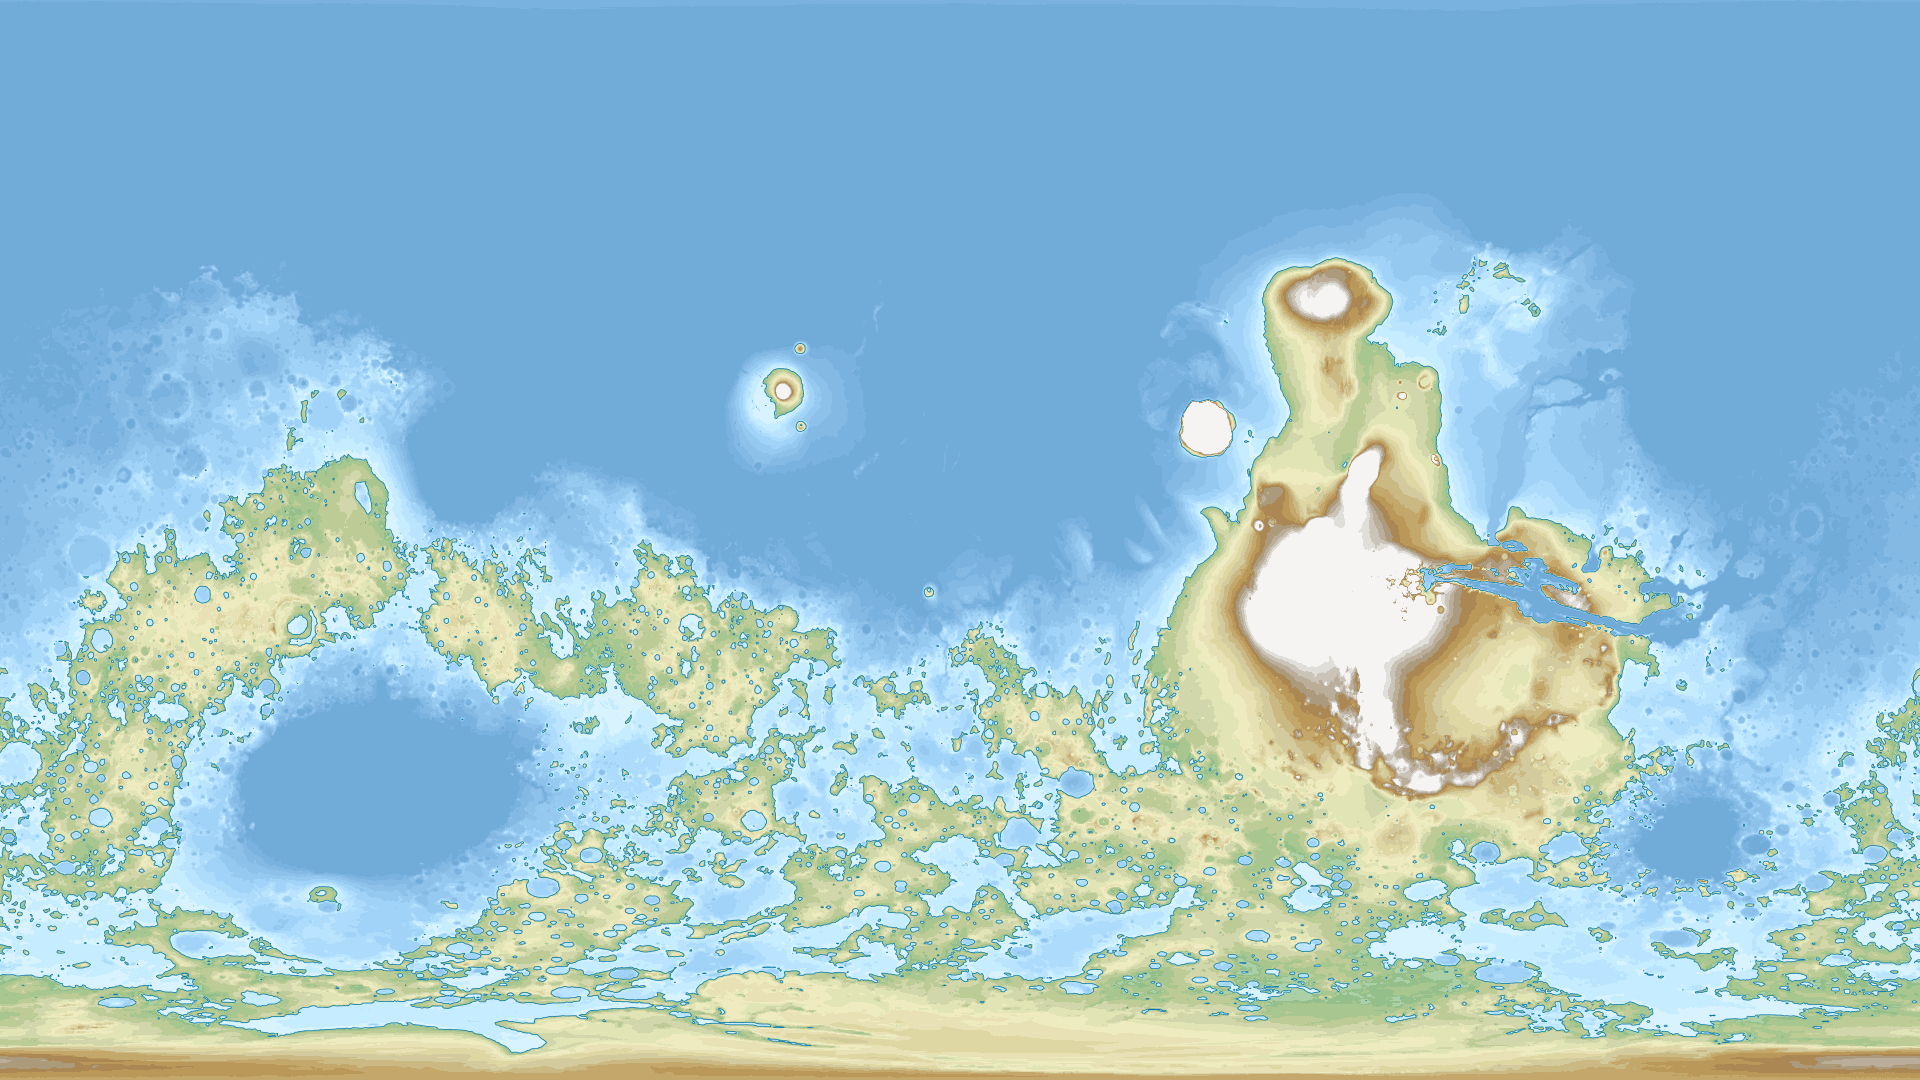 We can observe the remarkable Martian dichotomy and find:
- the Valles Marineris canyon on the right of the map (near the Tharsis volcanic plateau),
- the Olympus Mons, an alone snow-covered island close to Tharsis,
- the Hellas Planitia impact crater on the left of the map.
Mercury (update 2017)
 Here is Mercury above 55th parallel north, where the center of the map is the North Pole
That’s all! If you’re interested to plot those maps yourself and to create new ones, you can continue reading the next sections or directly check the github repository here.
To go further
- Flood simulation from 0m to 60m and the related blog post.
- If all the ice melted from National Geographic.
- Topographic map of Titan (moon of Saturne) here and here.
How to make those plots? I proceed in five steps.
- Get the data
- Transform it to raw files (with gdal)
- Files are big, reduce them (with the stream editors sed and awk)
- Plot data (with R)
- For some maps, conversion from png (or jpg) to pgm file extension.
Get the data. I get topographic data of the Earth from the NOAA website (see this, this and this). I took the bedrock file version with xyz grid format and 10' cell size. For the Moon, I find data from the NAOJ website (you have to create a free account before downloading). For Venus, you can pick the file here. Finally, for Mars, data are available on the MOLA subsite of the NASA (I took megt90n000cb img and lbl files). I didn't find any data for Mercury (I would be grateful if someone could send it to me).
Transform it to text files. Some files are not in raw text files, i.e. some files cannot be open directly with a text editor. Those are Mars and Venus data files, which have respectively ".img" and ".grd" filename extensions. I convert them into xyz files, i.e. text files with on each line the longitude, the latitude and the height. Thanks to K.J. Bennett, I was able to do this with the gdal-bin package and the following line code.
gdal_translate -of XYZ megt90n000cb.lbl megt90n000cb.txt
Files are big, reduce them. On my personal computer, it is difficult to manage text files with a size greater than 100 MB. Here, the data files for Venus and the Moon are respectively 1.5 GB and 500 MB. To read them, I reduce them by taking only some lines. I take the Moon data file as an example. I work here under Linux, but the following can be adapted in other operating systems. To read the beginning of the file, I use the "head" command:
head -30000 lalt_topo_ver3.grd.txt >firstLines.txt
I observe that there is 5760 lines for each latitude, then using the “split” command,
split -d -l5760 -a4 lalt_topo_ver3.grd.txt
I show that the data contain 5760×2880 lines.
Then, I delete every two lines with sed:
sed 'n;d' lalt_topo_ver3.grd.txt >moon1-0.txt
The new file has now 2880×2880 lines.
Next, to delete m lines every 2m with m=2880, I run this awk script (thanks to dubcek):
m=2880; awk -v m=$m '!((NR-1)%m) {n=!n} !n' moon1-0.txt >moon1-1.txt
I finally obtain a readable 2880×1440 lines file.
Plot data. I use R and the functions "contour" and "filled.contour" to plot data. The R file is available on this repository. For those plots, I take the Wikipedia conventions for topographic maps.
Conversion from png to pgm. For some maps, it is difficult to retrieve raw data, and we only have a png (or a jpg) file. The plotting program is able to plot new maps from those images after converting them to a file format named pgm (which is very close to the xyz file format). You can do as follows: